Your landing page is where clicks turn into customers. Or where they bounce. In 2026, the average landing page converts at 6.6% to 10.76% depending on how you measure it. Top performers hit 30% to 40%. The gap between average and great is massive.
This article compiles every landing page conversion statistic that matters in 2026. You will find data on industry benchmarks, mobile performance, page speed, form design, personalisation, and testing. Every number comes from a credible source.
Content Outline
Key Landing Page Statistics at a Glance
Metric | Value | Source |
Median conversion rate (all industries) | 6.6% | Unbounce |
Global average conversion rate (18 industries) | 10.76% | Landingi |
Top 10% landing page conversion rate | 11.45%+ | Unbounce |
Landing page software market size (2025) | $2.5 billion (CAGR 15%) | Archive Market Research |
Mobile share of landing page traffic | 83% | Unbounce |
Average landing page bounce rate | 60% to 90% | |
Form abandonment rate | 81% | Insiteful |
Best performing traffic source | Email at 19.3% conversion | MarketingProfs |
Conversion Rate Benchmarks by Industry
Not all industries convert at the same rate. The gap between the highest and lowest performing sectors is 39.23 percentage points (Landingi).
Conversion Rates by Industry
Industry | Median Conversion Rate | Top Performer Rate |
Events and Entertainment | 12.3% | 40.8% |
Education | 8.4% | 20.0% |
Financial Services | 8.3% | 26.1% |
Commercial and Professional Services | 6.1% | 14.1% |
Legal | 6.3% | 13.1% |
Travel and Hospitality | 4.8% | 15.6% |
4.2% | 11.4% | |
SaaS | 3.8% | 11.6% |
Source: Unbounce Conversion Benchmark Report
Events and entertainment lead the chart with a 12.3% median. SaaS sits at the bottom with 3.8%. But SaaS top performers still hit 11.6%, which is more than 3x the median .
Financial services convert at 8.4% on average because buyer intent is high and messaging is compliance-driven (MarketingProfs). The restaurant and food sector leads average rates at 39.93% (Landingi). Retail is the lowest at 0.70%.
Top-performing landing pages convert at roughly 3x the industry median. So if your industry median is 6%, aim for 18% .
Mobile vs Desktop Performance
Mobile drives 83% of all landing page traffic. But desktop still converts better .
Desktop achieves a 12.1% conversion rate compared to mobile’s 11.2%. That 8% gap means over 1.3 million missed conversions in Unbounce’s dataset alone (MarketingProfs, Unbounce).
53% of mobile users abandon pages that take more than 3 seconds to load (Google). Mobile-optimized sites convert 100% higher than non-optimized ones (Backlinko). Among top-performing landing pages, 86% have been optimized for mobile (Taboola).
Sites that are not optimized for mobile see a 60% bounce rate (Hostinger). Progressive web apps achieve 36% higher conversion rates than standard mobile sites (Cropink).
Page Speed and Conversion
Speed is money. Every 1-second delay in page load time reduces conversions by 7% (Fleexy).
Pages that load in 1 second convert 3x higher than pages that load in 5 seconds. The specific numbers: 9.6% conversion at 1 second versus 3.3% at 5 seconds (Portent).
Conversion rates drop 4.42% per second during the first 5 seconds of loading (Cloudflare). 47% of users expect a page to load in 2 seconds or less (Keywords Everywhere).
Pages loading in approximately 2.4 seconds convert roughly twice as well as slower pages (Landingi). A 0.1-second improvement on mobile increases conversion by 8% to 10% (Lovable.dev).
Google found that 70% of mobile landing pages take more than 5 seconds to display above-fold content and more than 7 seconds to load all visual content. This is a huge missed opportunity (Google Research).
Form Design and Friction
81% of users abandon forms after starting. 67% never return (Insiteful). Form friction is the single biggest conversion killer on landing pages.
The top reasons for abandonment are security concerns (29%) and excessive length (27%) (Insiteful).
Form Fields and Conversion
Number of Form Fields | Impact on Conversion |
4 fields | 120% better than 11 fields |
5 or fewer | Doubles conversion rate |
11 to 4 (reduction) | 160% conversion increase |
3 fields (from 4) | Up to 50% boost |
Sources: Cobloom, SEO Sherpa, Passionfruit
On average, landing pages have 11 form fields. That is far too many. Reducing from 11 to 4 increases conversions by 160% (Cobloom). Landing pages with 5 or fewer fields convert 120% better (Cobloom).
Multi-step forms can also help. They use progressive disclosure to reduce perceived effort. Users complete easy fields first before being asked for sensitive data .
Traffic Source Performance
Where your visitors come from matters just as much as what they see on the page.
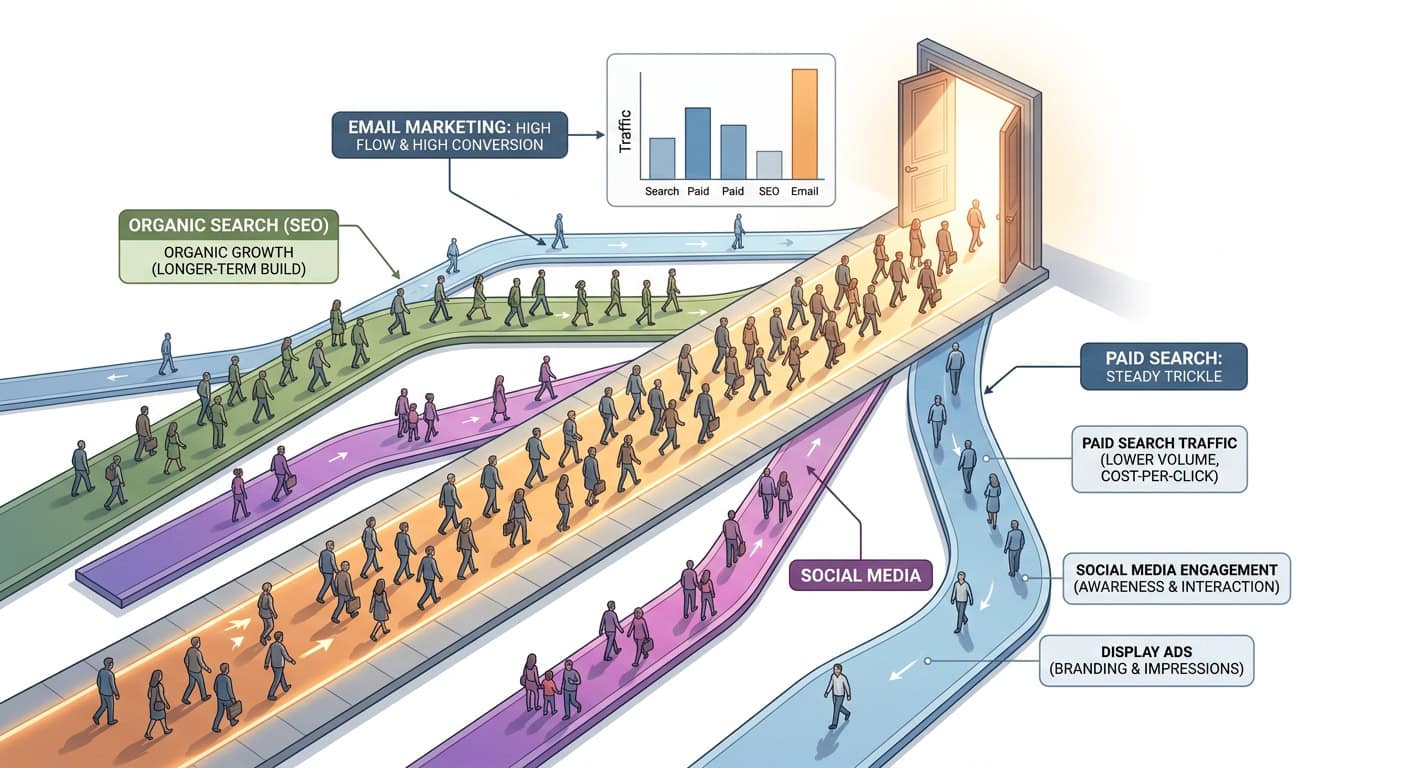
Traffic Source | Conversion Rate |
19.3% | |
17.9% | |
13.0% | |
Google Paid Search | 11.3% |
First-party data audiences | 4x higher than cold traffic |
Source: MarketingProfs, Unbounce, CustomerLabs
Email traffic converts at 19.3%. That is nearly double paid search (MarketingProfs). Instagram achieves 17.9%, approaching email’s effectiveness. Facebook sits at 13% .
First-party data audiences convert 4x higher than cold traffic. This makes owned-data strategy essential in a post-cookie world (CustomerLabs).
In commercial and professional services, email traffic converts 3.18x better than paid social. In legal services, mobile converts 1.32x better than desktop. In financial services, insurance pages perform 4.7x better than investing pages .
Content, Copy and Design Impact
90% of visitors read both the headline and the CTA. These are the two most critical elements on any landing page (Taboola).
Personalised CTAs convert 202% better than generic ones . Landing pages with multiple offers have a 266% lower conversion than those with a single offer (Involve.me).
Copy written at a 5th to 7th grade reading level achieves 11.1% conversion. College-level copy achieves only 5.3%. Simple language more than doubles performance (Backlinko).
Videos on landing pages increase conversion by up to 86% (Involve.me). Customer testimonials increase conversions by 34% (Keywords Everywhere). Displaying reviews can boost conversions up to 270% (Abmatic). 92% of consumers read testimonials before purchasing (Instant).
Personalisation and AI in 2026
AI-powered personalisation increases conversions by 40% (SaveMyLeads). AI-generated landing pages achieve 37% higher conversions than human-written control pages (Webbb.ai).
Only 17% of marketers actively A/B test their landing pages. But those who test see 37% higher conversion rates (Cropink). Companies testing 10+ variations see 86% better results than single tests (Conversion Sciences).
Companies with 40+ landing pages see 500% more conversions than those with fewer than 10. An increase from 10 to 15 landing pages leads to a 55% increase in conversions .
Dynamic pages have approximately 25% higher conversion than static pages among mobile users (Involve.me). Low-code landing page tools can cut page creation time by 90% (Involve.me).
Geographic Performance
EMEA outperforms the Americas by 15% and APAC by 49% in conversion rates. Cultural buying behaviours, device adoption, and market maturity all play a role .
Marketing leaders must adapt global campaigns to regional patterns rather than applying one universal approach.
FAQs
What is a good landing page conversion rate in 2026?
The industry median is 6.6%. A good rate is 10% or higher. Top performers hit 15% to 40% depending on the industry. Always benchmark against your specific sector, not the global average (Unbounce, Landingi).
How many form fields should a landing page have?
Aim for 3 to 5 fields. Reducing from 11 to 4 boosts conversion by 160%. Each extra field beyond 5 carries a 20% to 30% penalty. Use multi-step forms for high-value B2B offers (Cobloom, Unbounce).
Does page speed affect conversions?
Yes. Every 1-second delay costs 7% in conversions. Pages loading in 1 second convert 3x higher than 5-second pages. Aim for under 2.4 seconds (Fleexy, Portent, Landingi).
Which traffic source converts best on landing pages?
Email at 19.3%, followed by Instagram at 17.9%, Facebook at 13%, and Google paid search at 11.3%. First-party data audiences convert 4x higher than cold traffic (MarketingProfs, Unbounce).
Should I add video to my landing page?
Videos can increase conversion by up to 86%. They work best for complex products that need demonstration. But test before assuming universal benefit. Some industries see negative impact from video (Involve.me, Backlinko).
How many landing pages should I have?
More is better. Going from 10 to 15 landing pages increases conversions by 55%. Companies with 40+ landing pages see 500% more conversions. Each page should target a specific audience and offer.
Quick Links