Affiliate marketing crossed $19 billion in global spend in 2026 and it is now the third-largest performance marketing channel behind paid search and paid social. The numbers tell a clear story about where the industry has matured, where it is still growing, and what the data says about which approaches actually deliver results.
This article compiles 100+ data points from Forrester, Awin, PartnerStack, Impact, EMARKETER, Rakuten, and Performance Marketing Association research — with honest commentary on what the numbers mean for affiliates and program managers in 2026.
Content Outline
Quick Reference: Key Affiliate Marketing Statistics 2026
Metric | Number |
Global affiliate spend | $19.4 billion (Forrester 2026 forecast) |
US affiliate spend | $12–13.81 billion |
Industry growth rate | 10–11.3% year-over-year |
Projected global spend by 2027 | $22 billion |
Affiliate share of all e-commerce revenue | ~16% |
Average ROI | $12 for every $1 spent (PMA) |
Affiliate as a traffic source for top retailers | 16% of orders |
Creator affiliate revenue share growth | 15.9% → 19.5% (year-over-year on Awin) |
Discount/promotions publisher share of US affiliate revenue | 42.4% (up from 39.7%) |
Cashback/loyalty platform share of spend | 35% of affiliate ad spend |
Median ecommerce commission | 8.4% |
Median SaaS recurring commission | 22.5% of first-year revenue |
Travel affiliate commission | 4.2% |
$52 | |
B2B services average per qualified lead | $187 |
Publishers reporting concern about Google algorithm changes | 69% |
Market Size: The Numbers Vary — Here Is Why
Different sources report different market sizes for affiliate marketing, and that is not contradiction — it is methodology. Here is what each number measures:
Source | Figure | What It Measures |
Forrester 2026 | $19.4 billion | Global affiliate channel spend |
EMARKETER | $13.81 billion | US advertiser spend only |
Statista/GVR | $20–27 billion | Includes platform/software layer |
Astute Analytica | $20+ billion | Global industry valuation |
Projection (2027) | $22–31 billion | Forward estimate |
Projection (2034) | $71.74 billion | Long-range at 15.2% CAGR |
For practical purposes: $19.4 billion in global spend is the most current defensible figure for the affiliate channel itself. The global affiliate marketing platform market — the software powering programs — adds another $22.58 billion (Grand View Research, 2025).
Geographic breakdown of global spend:
North America: 47%
EMEA: 28%
APAC: 19%
Rest of world: 6%
Affiliate now accounts for approximately 16% of all e-commerce revenue — making it one of the top four customer acquisition channels for online retailers globally.
ROI: What the Data Actually Shows

The ROI story for affiliate marketing is strong — but the range is wide.
Average ROI: $12 for every $1 spent (Performance Marketing Association)
Display advertising comparison: 2:1 ROI
Paid social comparison: 4:1 ROI
Top-performing affiliate programs: $15+ per $1 spent
Bottom-performing programs: Break-even or below
The 12:1 average reflects affiliate’s structural advantage: performance-based cost. You pay only when a conversion happens. Every impression and click that does not convert costs nothing. This is why the channel consistently outperforms impression-based media on ROI calculations — the denominator only counts actual spend on actual results.
The practical caveat: affiliate ROI depends heavily on program management quality. A well-run program with vetted partners, accurate attribution, and active fraud prevention delivers significantly higher returns than a neglected program with poor partner quality and no monitoring.
Commission Rates by Vertical: What the Market Is Paying
Commission rates vary significantly by industry. This is the most current data from aggregated network data across Awin, Impact, PartnerStack, and ShareASale:
Vertical | Commission Type | Rate / Amount |
E-commerce | % of sale | 8.4% median |
SaaS (recurring) | % of first-year revenue | 22.5% median |
Travel | % of sale | 4.2% |
Finance (lead-gen) | Flat bounty | $52 average |
B2B services | Per qualified lead | $187 average |
Health/wellness | % of sale | 6–15% |
Software (one-time) | % of sale | 15–30% |
E-learning | % of sale | 20–40% |
Hosting | Per signup | $50–$200 |
SaaS commission structure evolution: PartnerStack’s 2026 data shows 71% of SaaS affiliate programs now pay recurring commissions:
First 12 months: 20–30% recurring
Months 13–24: 10–15% recurring
After month 24: Declining structure
Recurring programs generate 3.4x more partner-driven ARR over 36 months than equivalent one-time-bounty programs at the same blended customer-acquisition cost. For affiliates choosing between programs, this is the most important structural comparison.
Publisher Types: Where the Revenue Is Going
Publisher Type | Share of US Affiliate Ad Spend | Trend |
Cashback/loyalty/rewards | 35% | Dominant |
Discount/promotions | 42.4% of revenue | Growing (up from 39.7%) |
Content creators | 19.5% of network revenue | Fastest-growing |
Comparison and review | Significant | Stable |
Email publishers | Moderate | Stable |
Coupon sites | Included in promotions | Stable |
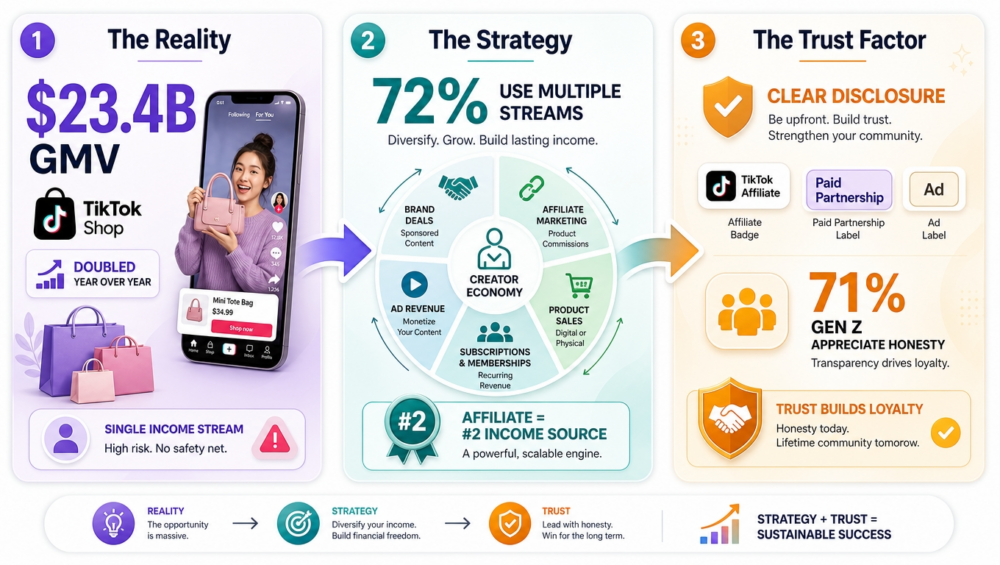
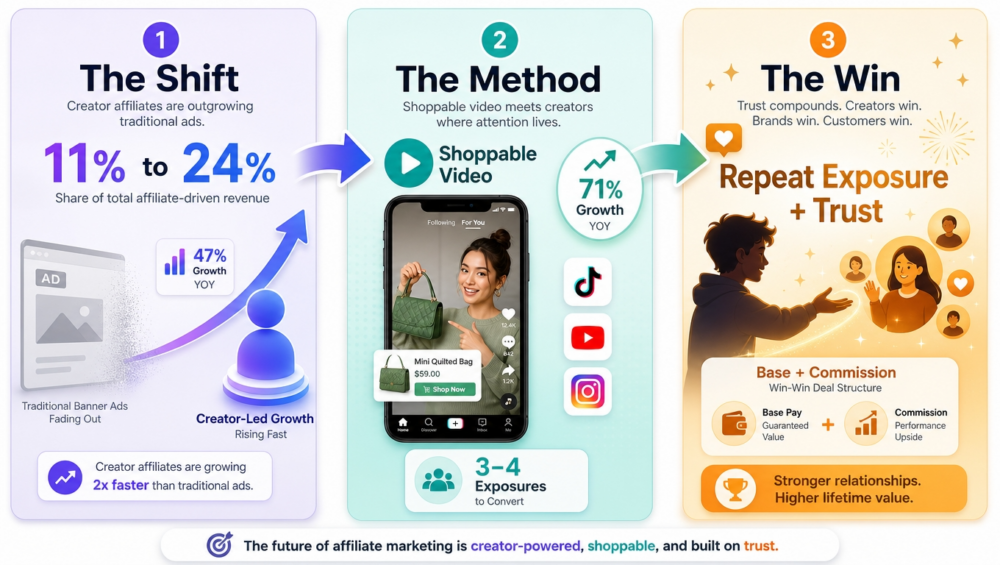
Content creators are the fastest-growing publisher type — their revenue share on Awin rose from 15.9% to 19.5% year-over-year. Discount and promotions publishers claimed 42.4% of US affiliate revenues in H1 2025, up from 39.7%, driven by consumer deal-seeking behaviour. Cashback platforms like Rakuten Rewards claimed 35% of affiliate ad spend in 2024 — the dominant single-publisher category.
The creator conversion pattern that matters: By the 8th brand integration with the same YouTube creator, affiliate link click-through rates reach 1.8x the rate of the first integration. Buyers typically need 3–4 creator exposures before purchasing. Long-term creator partnerships are not just a brand preference — they are a performance decision.
The Traffic Threat: Google and AI Overviews

69% of publishers report being concerned or very concerned that Google’s algorithm changes will hurt their affiliate businesses. This is the most significant structural threat to affiliate publishers in 2026.
What is happening:
AI Overviews answer queries directly, reducing clicks to affiliate review and comparison content
Wirecutter lost over 60% of its search visibility between May and August 2025
The number of queries sending traffic to third-party content is declining as AI surfaces direct answers
How affiliates are responding:
Diversifying to Reddit, Discord, email newsletters, YouTube
Building audiences in owned channels rather than depending on Google
52% of publishers say they will experiment with new forms of promotion in response
Affiliates who built traffic primarily through Google SEO face the most serious structural pressure. Those with multi-channel audiences — email, community, video, direct subscription — are significantly more resilient.
Network Landscape: Where Programs Live
The affiliate network landscape has consolidated since 2020:
Network | Position | Notes |
Awin (+ ShareASale) | Global #1 by publisher count | Acquired ShareASale in 2017 |
Impact | Leading enterprise platform | Rolled up specialty platforms |
Rakuten Advertising | Enterprise-focused independent | Strong in Asia-Pacific |
PartnerStack | B2B/SaaS focused | 71% of SaaS programs |
CJ (Commission Junction) | Established mid-market | Strong in retail |
Amazon Associates | Largest single program | Commission cuts have been significant |
Amazon Associates commission cuts since 2020 have significantly reduced revenue for product-focused affiliates. The shift toward SaaS, subscription, and recurring-commission programs has accelerated as a direct response.
What the Top Affiliates Actually Do Differently
High-earning affiliates (£10,000+ monthly) share consistent patterns:
Niche selection: They choose products based on trending opportunities and market data, not just personal experience. Top niches by monthly earnings (US data):
E-learning: $15,551/month average for top performers
Finance and SaaS: High commissions, large deal sizes
Health/wellness: Better conversion rates, lower commissions
Content format: Video content now drives 55% of affiliate traffic. Blog content still scales better, but video converts at higher rates for most niches in 2026. The winning approach is both — video for conversion, content for volume.
Commission model selection: Affiliates consistently choosing programs with recurring commissions over one-time bounties report significantly higher long-term income. The 3.4x 36-month revenue advantage of recurring structures is not theoretical — it compounds into a dramatic income gap.
Traffic diversification: The affiliates most insulated from Google algorithm volatility are those with email lists, YouTube audiences, or community presence that generates traffic independently of search engines.
FAQs
The affiliate marketing industry reached $19.4 billion in global spend in 2026, with the US market accounting for approximately $12–13.81 billion. The industry grows at 10–11% annually and is projected to hit $22 billion globally by 2027.
Commission rates vary significantly by vertical: SaaS recurring commissions average 22.5% of first-year revenue, e-commerce averages 8.4%, and finance lead-gen pays a flat $52 per lead. The most valuable rate is one that aligns mathematically with your traffic volume and conversion rates.
Yes, affiliate marketing remains highly profitable, delivering an average 12:1 ROI and driving 16% of all e-commerce revenue. However, sustainable income requires diversified traffic sources, as 69% of publishers cite Google traffic dependency as their single biggest risk.
PartnerStack is the leading network for SaaS and B2B affiliate programs in 2026, while Impact and Rakuten dominate enterprise retail. For the broadest publisher access, Awin and ShareASale remain strong options.
Despite commission reductions over the years, Amazon Associates still offers unmatched product reach and consumer trust, making it a strong choice for broad-audience publishers. For higher per-sale value, vertical-specific networks like PartnerStack or Impact typically outperform Amazon on a pure earnings-per-click basis.